


By Omri Wallach Article/Editing: Bruno Venditti Graphics/Design: Joyce Ma
Visualizing the Rise of the U.S. as Top Crude Oil Producer
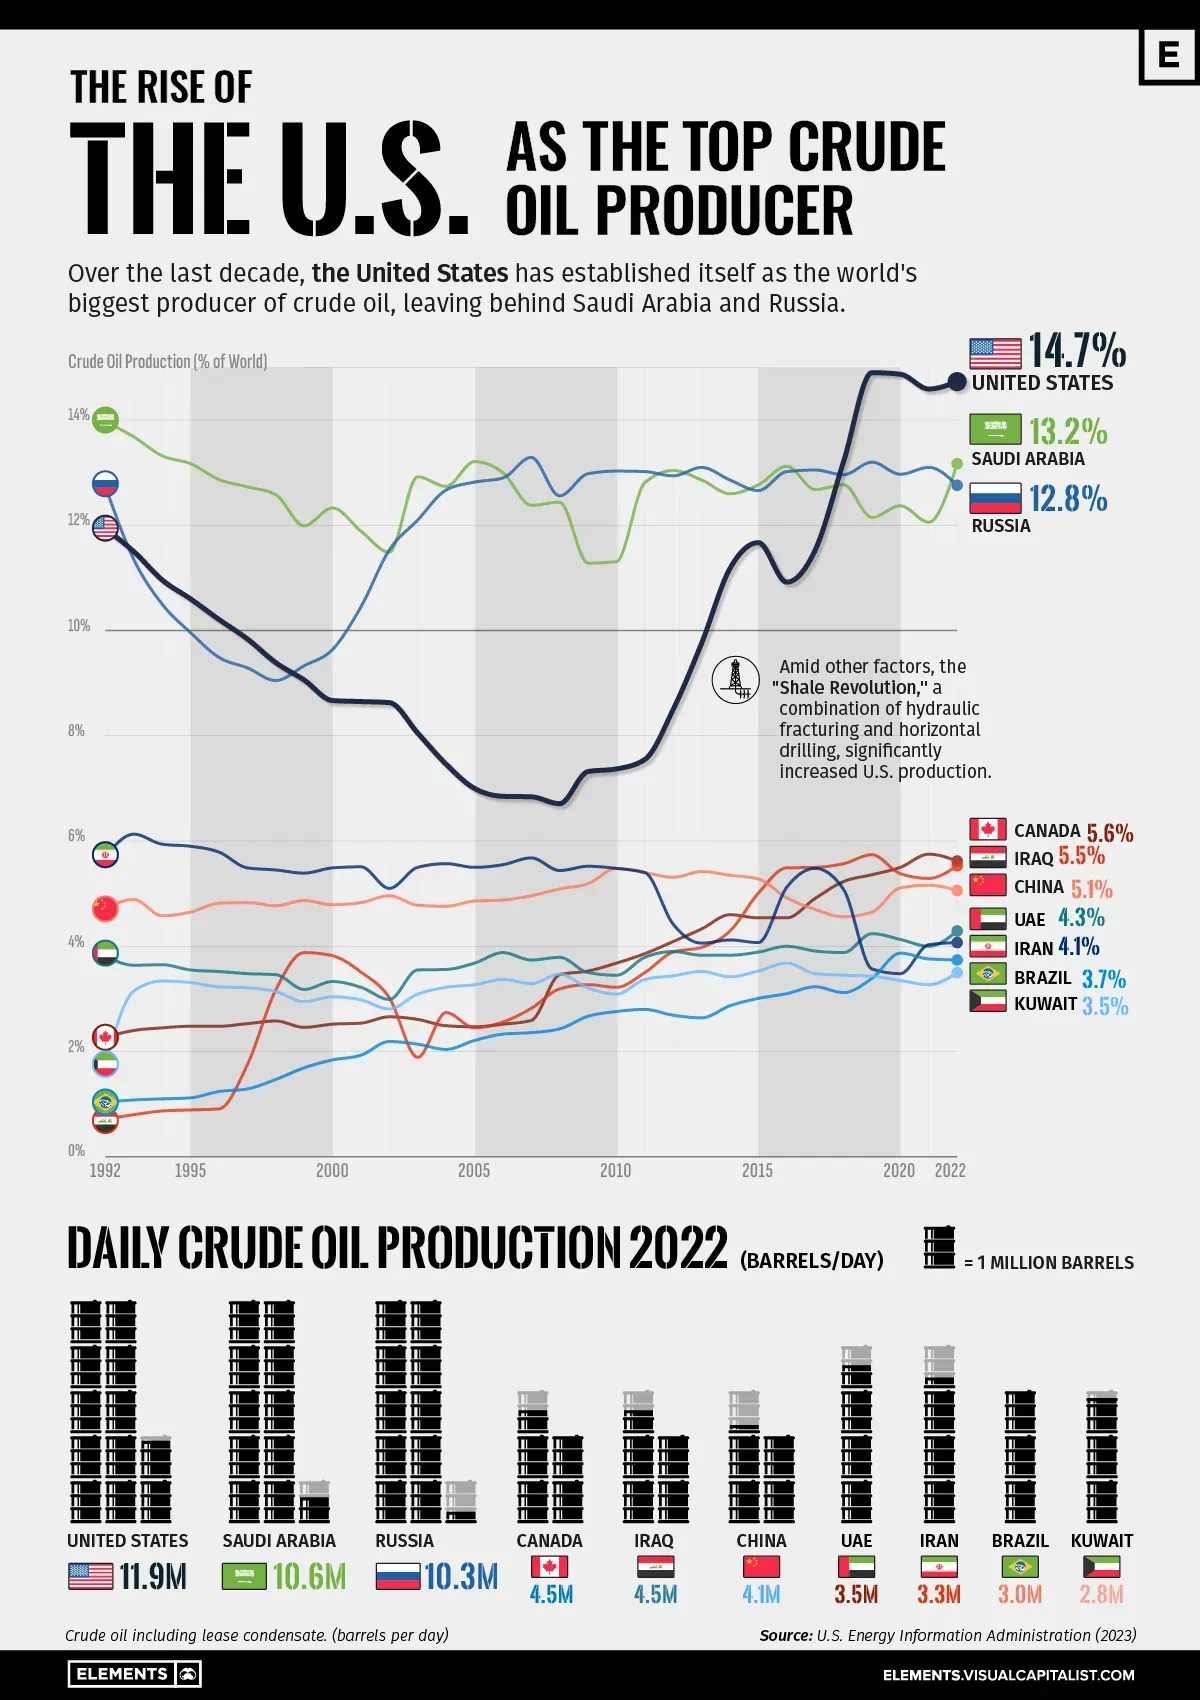
Over the last decade, the United States has established itself as the world’s top producer of crude oil, surpassing Saudi Arabia and Russia.
This infographic illustrates the rise of the U.S. as the biggest oil producer, based on data from the U.S. Energy Information Administration (EIA).
U.S. Takes Lead in 2018
Over the last three decades, the United States, Saudi Arabia, and Russia have alternated as the top crude producers, but always by small margins.
During the 1990s, Saudi Arabia dominated crude production, taking advantage of its extensive oil reserves. The petroleum sector accounts for roughly 42% of the country’s GDP, 87% of its budget revenues, and 90% of export earnings.
However, during the 2000s, Russia surpassed Saudi Arabia in production during some years, following strategic investments in expanding its oil infrastructure. The majority of Russia’s oil goes to OECD Europe (60%), with around 20% going to China.
| Crude Oil Production | United States | Saudi Arabia | Russia |
|---|---|---|---|
| 1992 | 11.93% | 13.97% | 12.74% |
| 1993 | 11.50% | 13.68% | 11.35% |
| 1994 | 10.96% | 13.32% | 10.50% |
| 1995 | 10.60% | 13.17% | 9.96% |
| 1996 | 10.21% | 12.87% | 9.49% |
| 1997 | 9.84% | 12.73% | 9.29% |
| 1998 | 9.39% | 12.58% | 9.05% |
| 1999 | 9.06% | 11.99% | 9.33% |
| 2000 | 8.67% | 12.33% | 9.64% |
| 2001 | 8.65% | 11.89% | 10.45% |
| 2002 | 8.63% | 11.49% | 11.53% |
| 2003 | 8.05% | 12.92% | 12.10% |
| 2004 | 7.46% | 12.74% | 12.67% |
| 2005 | 7.00% | 13.21% | 12.82% |
| Crude Oil Production | United States | Saudi Arabia | Russia |
|---|---|---|---|
| 2006 | 6.85% | 13.00% | 12.90% |
| 2007 | 6.84% | 12.38% | 13.29% |
| 2008 | 6.71% | 12.44% | 12.56% |
| 2009 | 7.32% | 11.28% | 12.98% |
| 2010 | 7.37% | 11.31% | 13.03% |
| 2011 | 7.55% | 12.81% | 13.02% |
| 2012 | 8.50% | 13.04% | 12.94% |
| 2013 | 9.76% | 12.86% | 13.10% |
| 2014 | 11.18% | 12.60% | 12.86% |
| 2015 | 11.67% | 12.77% | 12.66% |
| 2016 | 10.92% | 13.12% | 13.02% |
| 2017 | 11.53% | 12.68% | 13.05% |
| 2018 | 13.21% | 12.77% | 12.96% |
| 2019 | 14.90% | 12.15% | 13.20% |
| 2020 | 14.87% | 12.37% | 12.97% |
| 2021 | 14.59% | 12.06% | 13.10% |
| 2022 | 14.73% | 13.17% | 12.76% |
Over the 2010s, the U.S. witnessed an increase in domestic production, much of it attributable to hydraulic fracturing, or “fracking,” in the shale formations ranging from Texas to North Dakota. It became the world’s largest oil producer in 2018, outproducing Russia and Saudi Arabia.
The U.S. accounted for 14.7% of crude oil production worldwide in 2022, compared to 13.1% for Saudi Arabia and 12.7% for Russia.
Despite leading petroleum production, the U.S. still trails seven countries in remaining proven reserves underground, with 55,251 million barrels.
Venezuela has the biggest reserves with 303,221 million barrels. Saudi Arabia, with 267,192 million barrels, occupies the second spot, while Russia is seventh with 80,000 million barrels.
Copyright © 2024 Visual Capitalist